Start with the basics
Grams of pure alcohol are the common denominator
Beer, wine and spirits are difficult to compare by counting glasses alone. Both the serving volume and the alcohol percentage on the label determine the result.
Half a litre of 5% beer and a small measure of spirits can contain a similar amount of ethanol even though they look completely different. The calculator therefore converts every entry into grams of pure alcohol before adding them together.
A result in grams is not a judgement or a diagnosis. It is an arithmetic tool that lets you compare different drinks without guessing and without making the result depend on the local definition of a “standard drink”.
Volume
Enter the amount actually consumed, not the bottle capacity or a nominal glass size.
Drink strength
Use the % ABV shown on the label. Two beers of the same size can contain very different amounts of ethanol.
Pure alcohol
Grams let you combine beer, wine, cocktails and spirits in one clear result.
More than the total
A week has a shape
Two people can reach the same weekly total while drinking in entirely different patterns.
Look at three things together: the total amount of pure alcohol, the number of drinking days and the size of the heaviest evening. Concentrating much of the weekly total into a short period does not become less important just because the remaining days were alcohol-free.
Alcohol-free days are information too. They help show whether drinking is occasional or becoming a daily ritual. Having none does not by itself prove a problem, but it is a good reason to look at the habit more closely.
Weekly total
Shows the scale of consumption over seven days and makes consecutive weeks easier to compare.
Heaviest evening
Helps reveal whether most alcohol falls on one night out or one weekend day.
Alcohol-free days
Show rhythm and regularity that the total number of grams cannot reveal.
Better data
How to avoid accidentally undercounting
The largest error usually occurs not in the formula but in describing a serving.
Check the label
Values such as 4%, 5.5% or 12% make a real difference. Do not assume one strength for an entire category of drinks.
Estimate the pour
A home pour or cocktail may have a different volume from a bar serving. If you do not know, note the uncertainty.
Do not omit top-ups
Small servings between the main drinks are easy to forget even though they still count towards the total.
Log as you go
The later you reconstruct an evening, the more likely you are to confuse the time, amount or strength of a drink.
Context, not permission
How to understand lower-risk guidance
If confirmed guidance exists for the selected country, the calculator can show it beside the result. It is a population reference, not an individual safety boundary. Drinking less does not mean there is no risk, and exceeding it does not by itself show whether a particular person has developed a problem.
Risk also depends on age, health, medicines, pregnancy, a history of dependence and the way alcohol is consumed. In some circumstances the appropriate amount is zero, regardless of a weekly table.
Comparing your own weeks over time is most useful. Is the total rising? Are alcohol-free days disappearing? Is most of the total increasingly concentrated in one evening? Those are the changes worth noticing.
From calculator to habit
Cheers helps you see more than one week
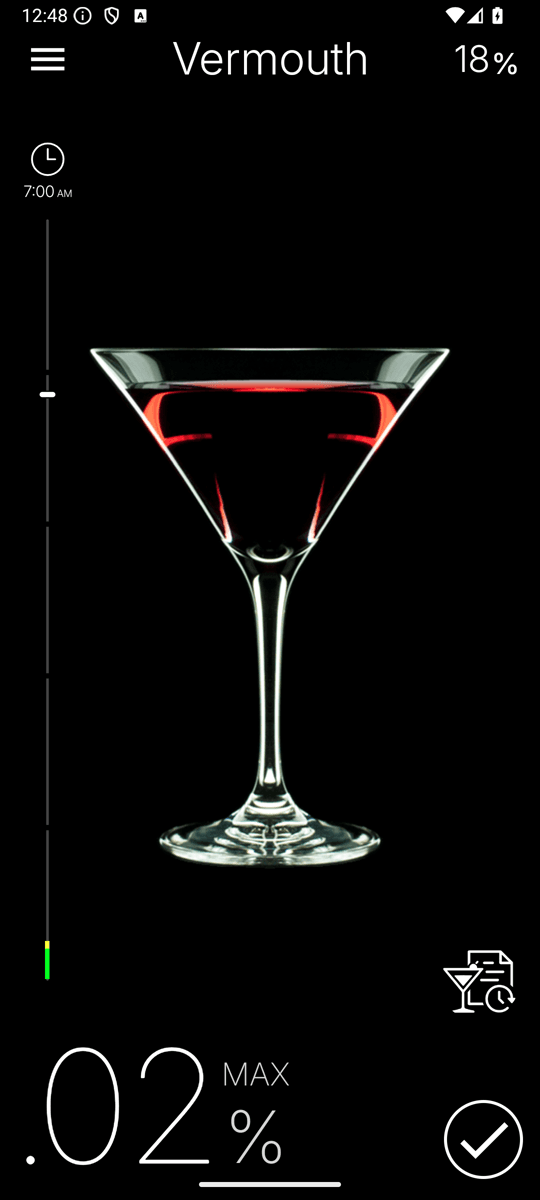
A one-off summary gives you a starting point. Session history in Cheers can make it easier to collect actual servings, times and peak estimates, then compare weeks without relying only on memory.
The app does not judge whether you drink “well” or “badly”. It helps preserve the data, notice changes in rhythm and prepare a more specific conversation with a doctor or therapist if something begins to concern you.